

What is a hypothesis test?
A statistical hypothesis is an unproven statement which can be tested. The hypothesis test is used to test whether this statement is true.
Structure of a hypothesis test
Step 1: State the null hypothesis (H0) and alternative hypothesis (H1)
The null hypothesis is the claim that we are trying to disprove.
The alternative hypothesis is the hypothesis that we are trying to prove. It will be accepted if we have sufficient evidence to reject the null hypothesis.
Example:
A company owns a machine which is supposed to pack rice into 1kg packets. The company does not want to change the machine unless evidence strongly suggests the machine is overpacking rice.
In this case,
H0: µ = 1000 vs
H1: µ > 1000
Step 2: Decide the test and significance level to be used
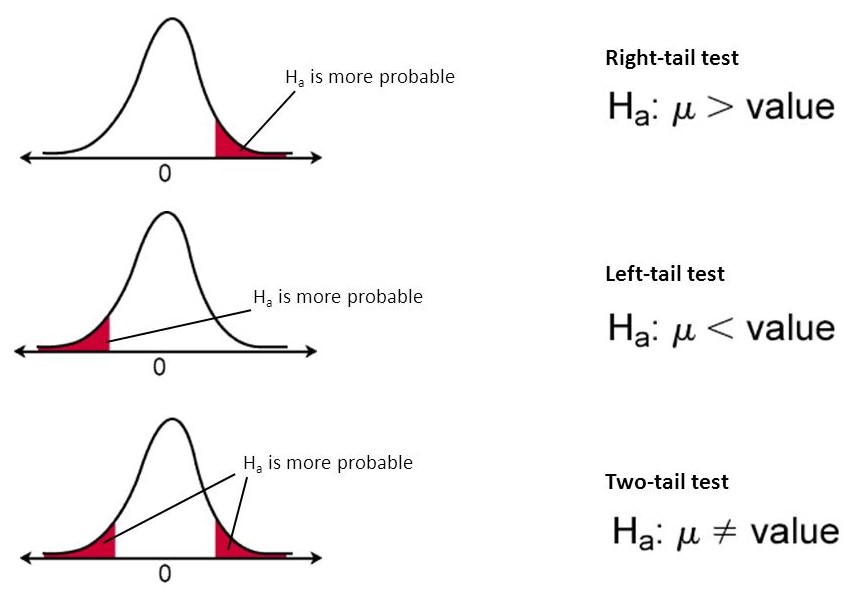
We use a one-tailed test when the alternative hypothesis specifies a direction. i.e. when the alternative hypothesis states that the parameter is in fact either bigger (H1: µ > x) or smaller (H1: µ < x) than the value specified in the null hypothesis.
We use a two-tailed test when we have an alternative hypothesis which does not specify a direction. i.e. when the alternative hypothesis states that the null hypothesis is wrong (H1: µ ≠ x).
The significance level (α) is the probability of rejecting the null hypothesis when it is true. The most commonly used level of significance is 5%.
Example:
For the case above, we conduct a one-tailed test at 5% level of significance.
Step 3: Analyse the data
Collect data to test your hypothesis and calculate the test statistic and associated p-value using the data.
Assuming the null hypothesis is true, the p-value is the probability of obtaining a sample statistic equal to or more extreme than the observed test statistic.
Step 4: Interpret your findings
Compare your p-value with the chosen level of significance.
If p < α, we reject H0.
If p ≥ α, we do not have sufficient evidence to reject H0 and therefore accept it.
The lower the value of p, the more confident we are that H0 is false.
Example:
For the case above, if we obtain p-value = 0.0309 (3 s.f.), we write the conclusion:
Since 0.0309 < 0.05, we reject H0 and conclude there is sufficient evidence, at a 5% level of significance, that the machine is overpacking rice and the company should change the machine.

